What is learning curve?
Definition:
- A learning curve means a graphical representation
that shows the relationship between output of a product and time. The target of
learning curve is to find out how the performance of the workers are improving
over time or how cost of production of a particular product is decreasing over
time.
- Learning curve was first described by Hermann Ebbinghaus in
1885 and it was used to measure production efficiency and to forecast cost.
Synonyms of learning curve:
Learning curve is also known as:
1. Experience curve: As it shows the effect of employee
experience on the process over time.
2. Cost curve: As it shows how cost of production or service
can be decreased through learning.
3. Efficiency curve: As it shows the increase in efficiency
of production or service over time.
4. Productivity curve: As it how the productivity increases
over time through learning.
Some typical shapes of learning curve:
Here, two types of learning curves figures are shown:
(Discussed from a factory perspective)
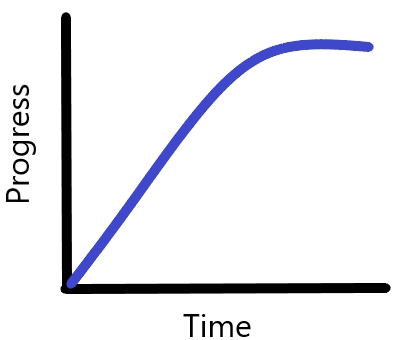
1. Production Vs. Time: Initially when the production of a
particular product starts, the workers need to learn about the processes and
methods. During the first few days, the workers have a lot to learn and
generally they learn quickly as the steeper portion of the first curve shows.
Eventually they reach to a point when they have nothing new to learn as a
result the learning curve become flatter.
2. Cost Vs. time: Initially when the production of a new
product starts, a lot of samples are prepared and some experimental activities
are done to find out what works best. That’s why initial cost is high. But
eventually factory starts the best practice starts and the cost of production
starts to decrease.
 |
| Production Vs. Time curve | Cost Vs. Time curve |
Theory of learning curve:
Basic theory: Learning curve states that production rate of a particular product increases and cost of production of that product decreases over time.
Also, it is a matter to consider that, there can be a lot of
factors that are responsible for the improvement in performance (for example:
using a work aid with the machine) but here only learning over time is tracked.
The basis of this model is the “Cumulative Average Model”
described “factors affecting the cost of airplanes” by T.P Wright in 1936. But
now-a-days different variation of the formula can be seen.
The original learning curve formula is:
Q= aXb
Here,
Q= the average time over the measured duration.
a= time to complete the task over the first time.
X= Total number of attempts
B= the slope of the function
When learning curve is applied?
Learning curve is only applicable when a specific measurable
task is performed again and again. The task must be repeated and measurable
and only one variable is tracked over time.
Also read: What is KPI | Elements and measures of KPI | Objectives of KPI | KPIs in a garments industry
Types of learning curve:
There are 4 types of learning curve.
1. Diminishing-return learning curve:
The learning curve is steeper in the beginning and eventually
become flatter. This type of curves are found in those cases where there is a
rapid initial learning.

2. Increasing-return learning curve:
The learning curve is flatter in the beginning and eventually
become steeper. This type of curves are found in those cases where there
initial learning is slower.

3. S curve or Increasing –decreasing learning curve:
Initially the curve is flatter as learners are learning, then
after a point the learners learn their job and the curve become steeper and
then it again become flatter as new challenges are introduced.

4. Complex learning curve:
Initially learning is slow, then some time the curve shows an
increase, then again the curve become flat as the learners feel that they have
mastered the skill and then again new challenges are introduced and the curve
goes up.

Application of learning curve in textile and apparel production (case study):
Here is an example of learning curve application in the sewing floor:
Case: A garment industry has got a repeat order of a ‘tilly’
(ladies tank top). They have worked on that order last summer. The IE officers
record the data of the output garment in every hour.
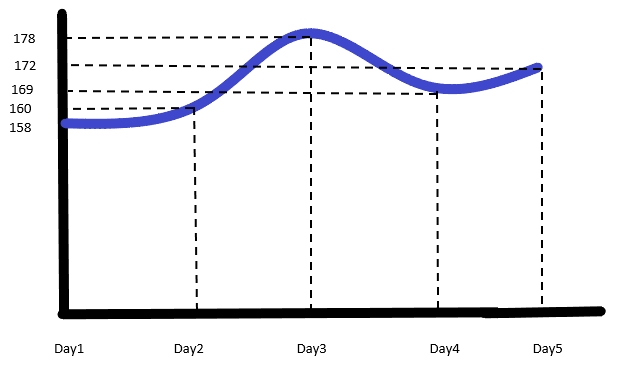
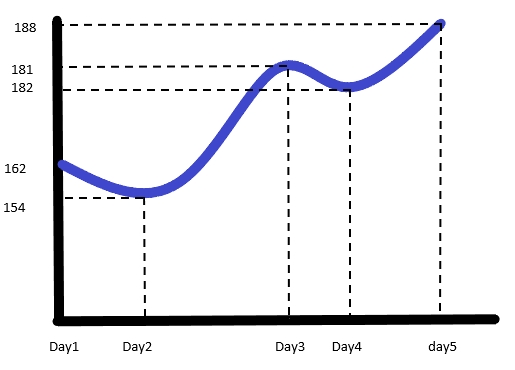
Below we can see the data collected for 5
days, at 10 am and at 11 am.

Graph representation of the data collected at 10 am:

Graphical representation of the data collected at 11 am:

This two graphs shows in the garment industry learning curve
generally follows complex curve or “S” curve and also the shape may change
every day.


0 Comments